Investing · Public marketsLate September 2001
Amazon, 2001
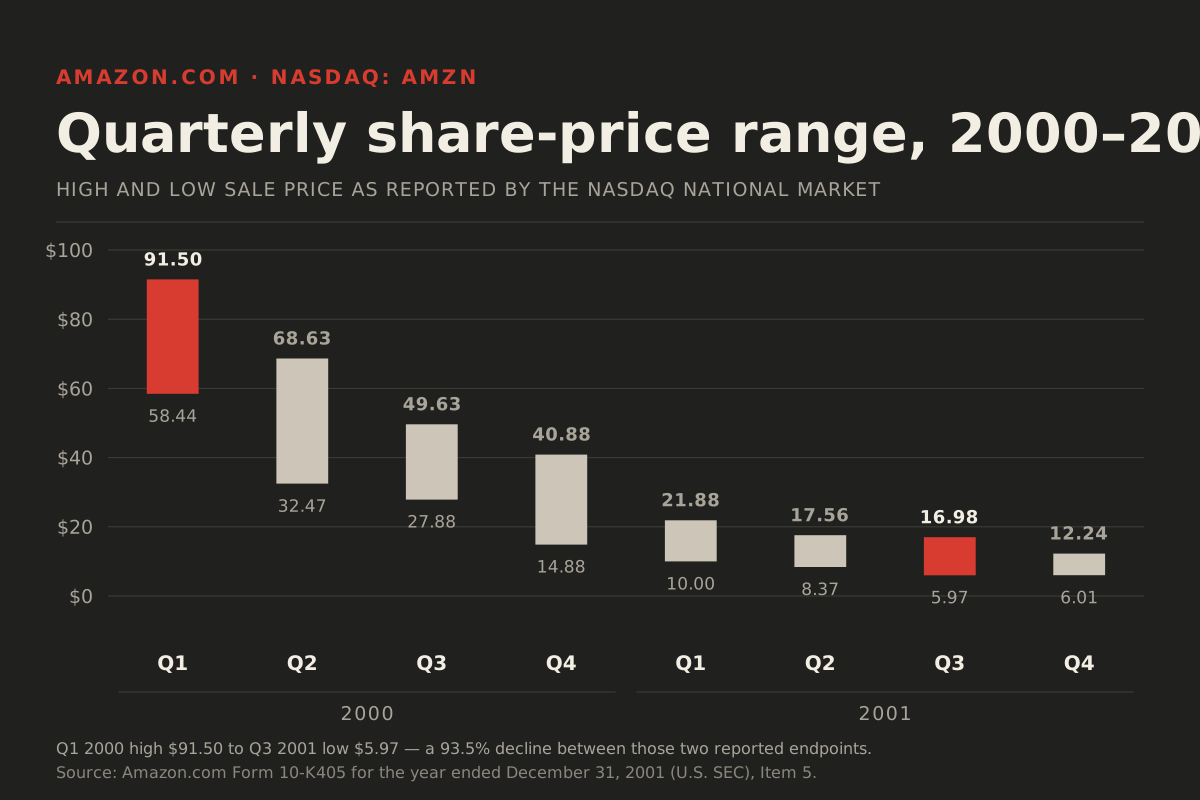
The dot-com bubble has burst. Amazon is losing money, carrying substantial obligations, and trading near a quarterly low. You have only the company’s latest public filing and the market in front of you.
- The share price had fallen from a Q1 2000 high of $91.50 to a Q3 2001 low of $5.97.
- Q2 net sales were $668 million, 16% above the prior-year quarter.
- That same quarter produced a $168 million GAAP net loss, while long-term obligations were about $2.1 billion.
What happened next
The ugly chart was not the whole company.
Amazon survived, diversified far beyond books, and became one of the world’s largest companies. Getting there included years of volatility and more than one severe drawdown.
93.5%Reported range decline
$5.97Q3 2001 quarterly low
+16%Q2 sales growth year over year
Historical simulation, not investment advice. The 93.5% figure compares quarterly range endpoints, not a guaranteed trade. Returns depend on exact execution, splits, dividends, fees, taxes, and the ability to hold through later drawdowns.
Visitor percentages appear after 25 distinct responses. We will not invent an audience.