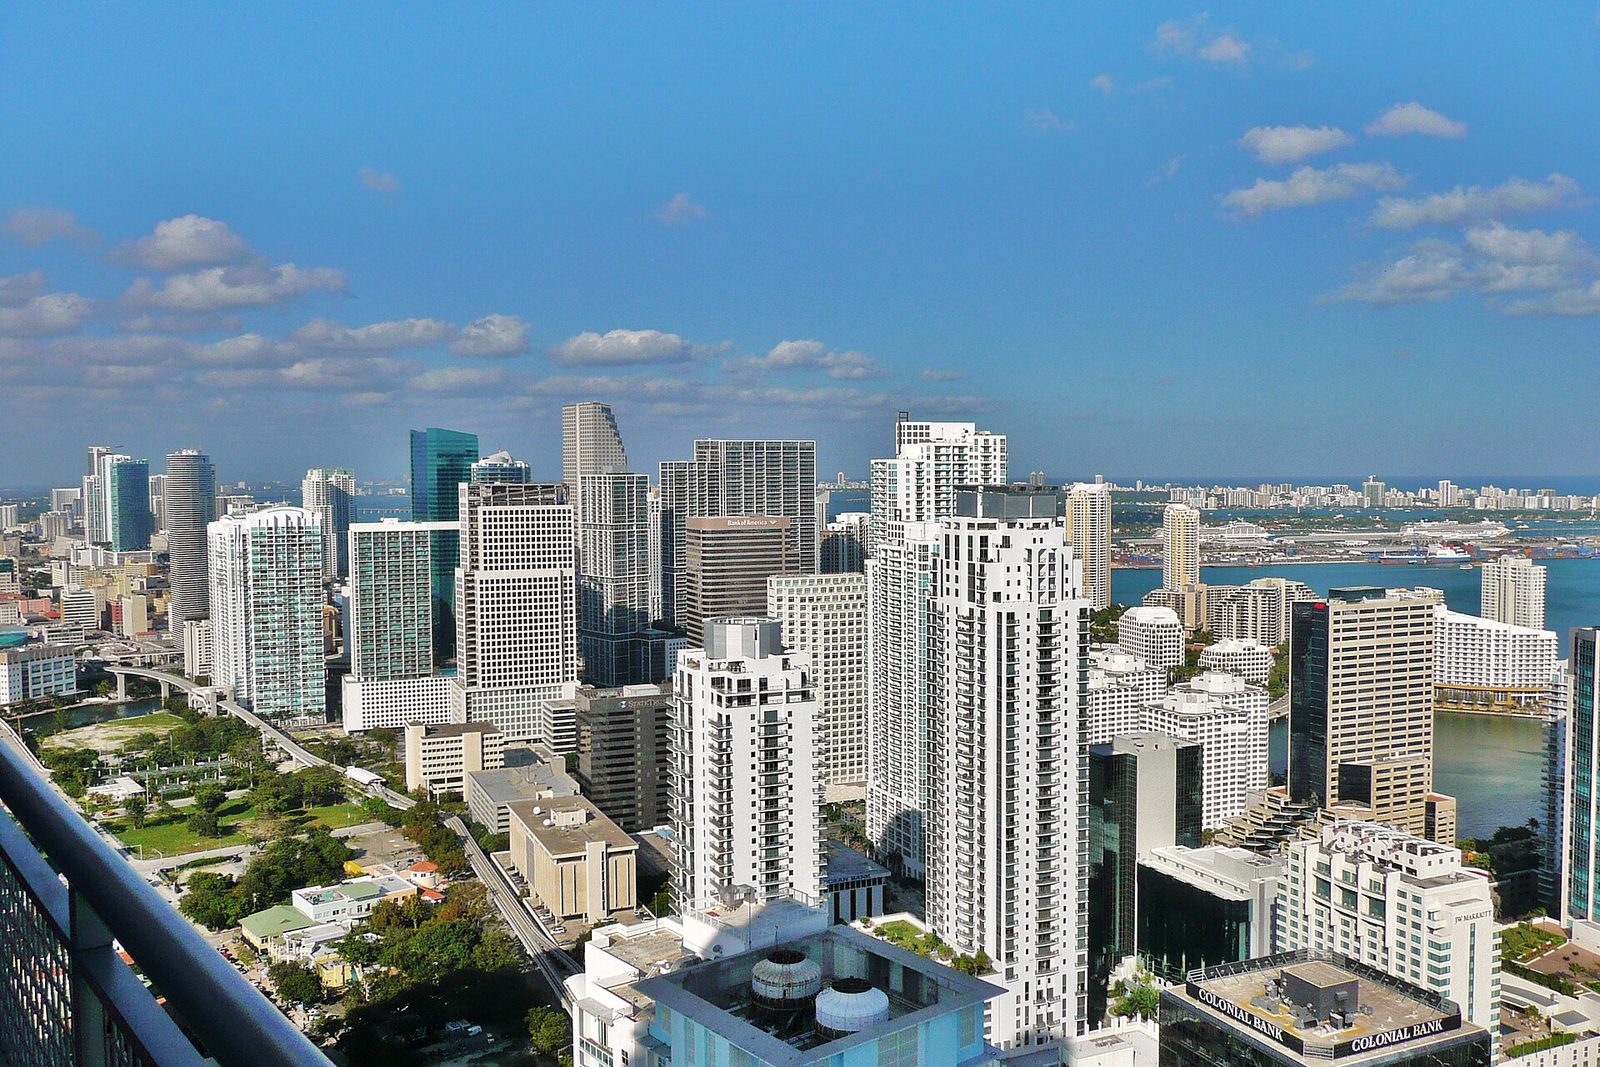
Miami’s Brickell skyline photographed on 6 February 2010, inside the quarter this record is set in. Photograph: Averette · CC BY 3.0 · Wikimedia Commons
Show your assumptions
What would it be worth?
A narrow calculator with a real dataset is better than a broad one that invents precision. The launch edition starts with one FHFA property-index illustration.
Index-tracking illustration
$850,000Method and source
Index-based illustration, not an appraisal or investment return. Excludes financing, taxes, insurance, maintenance, improvements, transaction costs and rent.
Series: FHFA All-Transactions House Price Index for Miami-Miami Beach-Kendall, FL (MSAD), ATNHPIUS33124Q
Federal Reserve Bank of St. Louis / FHFA data ↗Formula: starting amount × ending index ÷ starting index. Annualized change is the compound rate between the two index observations. This is a counterfactual estimate, not money somebody literally lost.